Nuclear reactor technology has allowed the world-wide use of nuclear reactors for energy production. With the world faced with mounting carbon dioxide levels and global warming a concern, nuclear energy provides a low carbon emission alternative to traditional energy sources (World Nuclear Association and MIT study). This aspect of nuclear energy makes it a very attractive energy alternative. With President Obama wishing to expand the United States nuclear power plant program, the question becomes an issue of balance-of-risks.Accelerating nuclear reactor development provides a low carbon emission energy source; however there is risk associated with the use of nuclear materials. If we do not take advantage of nuclear’s low carbon footprint and instead pursue other, higher carbon footprint strategies, we risk exacerbating global warming issues. There are other options, as well, such as cleaner technologies, emerging energy technologies and reducing fertility rates to decrease population size.We seek to understand the low probability, high impact, long-tail risks associated with the use of nuclear materials. Since the dawning of the nuclear age, mankind has worked to harness the power of the atom. There have been many benefits from the use of radionuclides. However, there are risks as well.Risk areas to consider in looking at nuclear energy include:- Economic, including Externalities
- Design and Construction
- Natural Disasters
- Operations and Management
- Political and Regulatory
- Terrorism, War and Sabotage
- Radioactive Waste Treatment and Storage
We have had experience with nuclear accidents that display some of that high impact, long-tail risk. Previous blog articles have discussed Chernobyl, Three Mile Island and Fukushima (3/12/11, 3/25/11 and 3/28/11).We have seen historical flooding on the Missouri River which threatened Fort Calhoun Nuclear Plant and Cooper Nuclear Plant in Nebraska. Recently we have seen the large Las Conchas Wildfire threaten the Los Alamos Energy Department facility in New Mexico. These situations, including those situations where facilities were threatened but not breached, are all reminders that radiation is a serious risk and not simply an abstract probability.
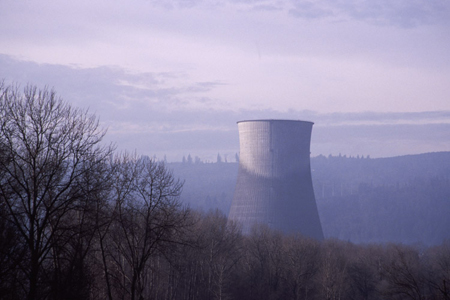
Externalities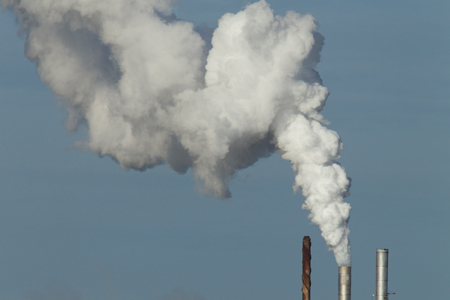 Refinery Exhaust Stacks, Anacortes, Washington (image on Photoshelter)Air pollution from a fixed stack is a good example that can be used to explain the concept of an externality. I discussed the externalities previously in a blog article (Risk and Externalities) in the context of the BP oil spill and its widespread impact in the Gulf of Mexico. On the production side, externalities come into play when the full cost of production is not reflected in the cost of the good.Air pollution emissions may contain various pollutants, gaseous and particulate matter. The area impacted and the degree of impact will be affected by the pollutants released and the meteorological conditions.For example, a temperature inversion will keep cold air close to the surface under a layer of warm air so that the air does not mix well vertically. The pollutants will be kept closer to the surface and their impact will be greater.Sulfur dioxide emissions may impact lakes and fish (as acid rain), and thus ecosystems. Sulfur dioxide is a harmful pollutant for humans as well as fish. Sulfur dioxide can adhere to airborne suspended particulate matter. If the particulate matter is small, this may ease entry into the lung where the sulfur dioxide can do greater harm. Air pollution is a direct result of the manufacturing process that extends from the stack into the community and beyond. It’s impact results in costs to others. Thus there are costs associated with air pollution that are not included in the production costs. To the extent that this is true, the product produced is under priced, and the public, an external entity, is paying those additional costs.Costs include medical costs, as well as reduced life expectancy due to the pollution. Air pollution, in addition to being unhealthy, reduces visibility, may add odor, and adds quality of life issues. Pollution impacts maintenance of buildings and other structures.Determing costs attributable to air pollution is a complex problem. There have been studies done to ascertain such costs. For example, a RAND study looked at health costs in California attributable to air pollution above state standards. That study would reflect air pollution due to a variety of causes, not just the point sources discussed in this blog article. California has a great deal of automobile pollution which contributes to carbon monoxide and ozone pollution problems. Monitoring and regulation of air pollutants requires resources as well. Air pollution regulation and monitoring exists at the federal, state and local levels. To reiterate, the producer’s price does not reflect these costs. Thus the price of the good is under priced with respect to other options because it does not include the cost of these “external” costs which others must bear. When full external costs are brought into the mix, the producer’s price must necessarily increase. As it increases, other competing options may become more attractive and the producer may lose business. Alternatively, the producer may choose to upgrade the method of production to reduce the pollution, a cost they may not be willing to take if full external costs were included.Air pollution is one example of an externality. The situation becomes more complicated where the risk matrix considers low probability, high risk events. Such events may be difficult to estimate and to price for. Even assuming these low probability, high risk events could be reasonably priced for, it may be impossible for the producer to compete with prices reflecting such a risk margin. Competitors in the same field may refuse to include such a risk margin, thus driving the producer out of business. Competitors in other fields without such a risk margin will be at an advantage.Where the risk margin for the low probability, high impact event is not priced for and is not included in the pricing there is the potential for considerable externality impacts should the low probability high impact risk event materialize. As previous nuclear disasters have shown, the low probability, high risk event presents considerable externality issues in the nuclear arena, considering the serious impacts of radiation. (See my blog articles, Chernobyl 25th Anniversary and Energy Choices and Risk).
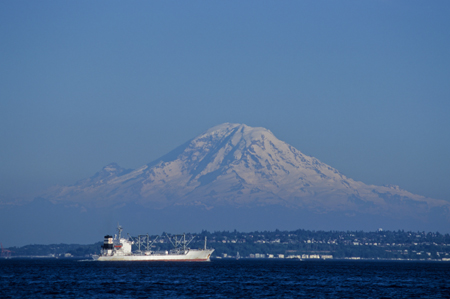
Low probability - high impact events present difficulties in weighing the balance of risks in such events. There may be an intellectual understanding that the risk exists and what its consequences are. However, how that intellectual understanding is translated into that marriage of sense and intellect that informs the weighing of risks, is problematic when the high impact event happens so rarely in our experience. Experience, after all, guides our reactions and decision-making in the face of risk. We experience intellectually and emotionally, and this informs future choices. We are guided by instinctual underpinnings that alert us to danger.When we weigh the balance of risks we look at how to mitigate the low probability - high impact event. This includes identifying the risks and probabilities, assessing how to prevent them if possible and how to mitigate the impacts should they occur. What is the cost of dealing with the risk versus the impacts of ignoring them as if they could never occur in our lifetimes, putting our heads in the sand and tempting to fate?Studies that the United States Geological Survey (USGS) have done regarding the various risks associated with Mt Rainier are an example of risk assessment. These studies outline probabilities of various classes or sizes of volcanic events occurring. Mt St Helens and other Cascade Volcanoes I discussed the impact of the Mt St Helens 1980 volcanic eruption and potential volcanic hazards in the Cascade volcanoes. Risks of volcanic hazards have been closely studied on Mt Rainier and are discussed in the USGS report on “Volcano Hazards From Mount Rainier, Washington”, 1995. Mt Rainier’s proximity to major population centers, and it’s size, with a summit at 14,410 feet, mean that Mt Rainier presents an important risk, both in the scale of a potential geological event and potential population impact. Mt Rainier is 54 miles southeast of Seattle and 37 miles east of Tacoma..The USGS examines each of the volcanic risks in detail. It discusses risks from tephra (volcanic gas/rock ejecta), ballistic projectiles, pyroclastic flow and surges, lava flows, volcanic gasses, debris avalanches and lahars, lateral blasts and glacial outburst floods. All of these are impressive risks. My previous post on Mt St Helens and other Cascade Volcanoes points to excellent USGS material on these topics.What impressed me most about the Vocanco Hazards From Mount Rainier, Washington (USGS) was the information regarding hazards from debris avalanches, debris flows and lahars. The report states:“Circumstances conducive to future debris avalanches and debris flows—substantial volumesof hydrothermally altered rock, substantial topographic relief, great volumes of ice, and thepotential for renewed volcanism—are all present at Mount Rainier. Thus, debris flows are a greater threat to communities down valley from Mount Rainier than any other volcanic phenomenon.” “Volcano Hazards From Mount Rainier, Washington”, (USGS)Debris avalanches, flows and lahars can arise from weakened mountain rock that has been hydrothermally altered by the action of acidic volcanic gases below the surface to a clay substance that undermines the structure of the mountain, leaving it susceptible to failure. The USGS report, explains this as: “Like a house infested with termites, the affected part of the volcano eventually becomes so weak that it collapses under its own weight, and generates a debris avalanche”These type of debris flows, containing high quantities of water and hydrothermally altered material are called “cohesive” debris flows.What I found particularly interesting was that debris avalanches and flows can occur without the type of warning that is typically available when a mountain begins eruptive activity. This may happen if the debris avalanche is due to causes not related to magma movement within the mountain. Weakening in the mountain structure due to underlying hydrothermally altered rock, or, a steepening in mountain slope walls with attendant loss of stability due to glacial erosion (USGS report) can increase the risk of debris avalanche. The historical retreat of glaciers has let mountain sides steepen as the glacier retreats. The Osceola Mudflow, 5600 years ago, was a cohesive debris flow and the largest debris flow in the last 10,000 years. The flow reached Commencement Bay. The National Lahar, about 1200 years ago flowed all the way to Puget Sound, inundating the Nisqually River. 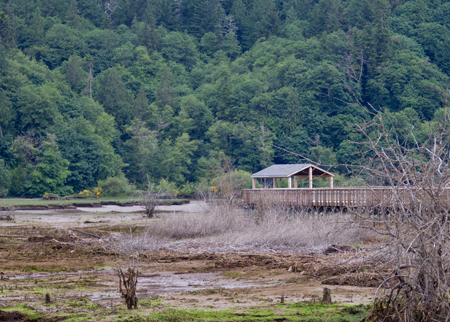 Nisqually Tideflats and Boardwalk, Nisqually Wildlife Refuge, Olympia, Washington (on Flickr)
The USGS has grouped debris flows into categories according to severity. Class M, the greatest, applies to the Osceola mudflow. This category occurs too infrequently to allow the USGS to assess an annual probability. The USGS Map Insert Low Probability High Consequence Events shows the extent that would be covered by a class M event.The USGS Map Volcano Hazards From Mount Rainier similarly displays flows expected from Class I, II and III events. An example of a Class I event is the Electron Mudflow which reached the Puget Sound lowlands. According to the USGS, Category I occurs on average 500 to 1,000 years (over a 5,600 year period) with an annual probability of .1 to .2 percent. Class II occurs on average 100 to 500 years tending towards the lower end of the range with an annual probability of 1 percent. The USGS puts this more in the realm of a engineering categorization of a “100 year flood” in it’s paper. Class III debris flows are more common. Kautz Creek, Mt Ranier National Park, Washington, March 2008 (on Photoshelter)
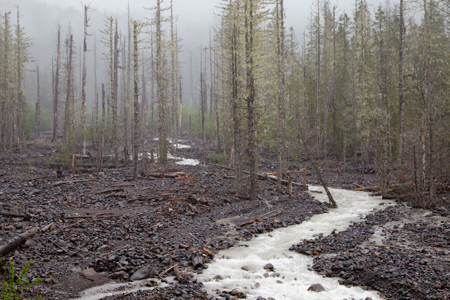
The Kautz Creek Debris Flow of October 2-3, 1947 was an intermediate size debris flow of class II. It was the largest debris flow since the park was established. It is thought to have been triggered by heavy rains that triggered an outburst flood from Kautz Glacier. The photo shows Kautz Creek in snow, with the water coloring reflecting the iron deposits and geothermal activity of Mt Rainier. Debris flows occur along Tahoma Creek. These debris flows may impact a bridge near the park entry, thus requiring dredging and other maintenance.Mt Rainier has displayed some powerful rock and snow avalanche activity in recent days. An article and photographs in the Seattle Times portray this powerful activity.Mt Rainier “speaks to us”. We cannot simply consider our environment an inanimate actor upon which we act; indeed our environment may present us with challenges that tax our abilities just at the moment when we are most complacent. I can recall being on the Emmons Glacier with a group when it was 90 degrees in Seattle; suddenly boulders were rolling down the moraine and we soon (carefully) crab-like scurried down the moraine. A wonder that a glacier would want to melt in the heat, but apparently it does just that. Debris flows often have their origin in heavy rains and hot temperatures.So the challenge is to internalize the risks in a fashion that doesn’t over exaggerate the low probability high impact event, yet at the same time seeks to mitigate the associated risks with all risk classes. This involves enjoying Mt Rainier in its many splendors while at the same time understanding its risks, even those that may at time seem remote.
In a recent blog article on Mt St Helen’s 31st anniversary, I discussed a visit to the Mt St Helens National Volcanic Monument and displayed some images of earlier 2006 volcanic steam activity. Today, in 2011, Mt St Helens today is relatively peaceful. The U.S.G.S. Cascade Volcano Observatory has assigned it a “normal” rating (since July 2008) reflecting its relative quiet. The explosive eruption (and buildup) of May 18, 1980 is far behind us, and the volcano has left some distance between the eruptions of 2004-8 and today. The image shows clouds dancing across the crater, not steam of volcanic origin.Indications are that Mt St Helens will continue its eruptive activity and is likely to erupt again in this century. (Mt St Helens - A 30 Year Legacy of Volcansim - EOS-AGU). This is based on its age and past history.In my last article, “Calculating Odds and Probabilities” I discussed the assessment of various odds and probabilities ranging from coin tosses to weather forecasting. It is clear that some predictions are relatively straightforward and others are incredibly complex. The events, risks and probabilities associated with volcanic hazards present a great challenge because of the wide ranging risks, the variability of impacts and the low probabilities of occurrence associated with very high impact events.Mt St Helens showed us in 1980 that a low probability, high impact event can happen in our lifetime and region (Washington State). While Mt St Helens is the most active of Cascade Volcanoes, the other Cascade Volcanoes are also of interest.The USGS provides an interactive map of the Cascade Volcanoes from Washington to Northern California. The summary provides a broad overview picturing the scope of Cascade Volcanoes throughout the region. The map/page provides links to each of the Cascade Volcano “Visit a Volcano Site” providing a photo and information for each volcano. The difficulty in assessing the risk associated with an event, whether it is meteorological or seismic, is in assessing the probability that it will occur, the severity of the event should it occur, and the impact on the population.The USGS has done a great deal of work in identifying hazards for the Cascade volcanoes. The Mount St Helens eruption, and other volcanic eruptions have allowed geologists to gain a great deal of information regarding volcanic hazards, and develop advanced monitoring technologies to allow them to better manage volcanic risk.A USGS Fact Sheet (What are Volcano Hazards?) describes Volcano hazards, both in text and with a graphic that displays the hazards on a simplified Cascade volcano. The hazards shown in the Fact Sheet include hazards that we saw with the 1980 Mt St Helens eruption. The pyroclastic flow that blasted down numerous trees, scorched others and killed people. The towering ash cloud that rained ash fall on Eastern Washington and continued around the world. The debris flows that sculptured the landscape in destructive lahars , racing down the Toutle River, washing out bridges and silting up the Columbia River.
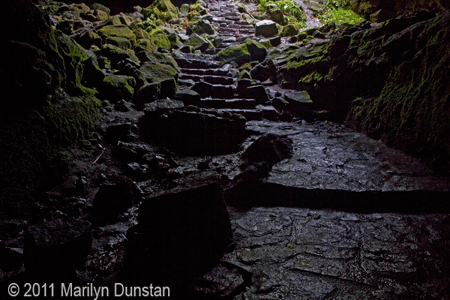
In addition, we see the impact of much earlier lava flows in Mt St Helen’s Ape Cave Lava Tube. Ape Cave contains the continental United States’ longest continuous lava tube, occurring around 2,000 years ago in the Cave Basalt.Cascade volcanoes have an extensive volcanic history, as displayed in a display of their eruptive history over the past 4,000 years which is available as a pdf or poster to order from USGS. We can look at the chart of volcanic history and wonder given the frequency and time since last eruption, whether a particular mountain is “due” for an eruption. We do know that future eruptions may occur, we simply may not know when. Once volcanic activity has started, geologists are better able to monitor and respond to the ongoing situation.It is a matter of living with uncertainty and managing risks. The USGS has comprehensive risk assessments for each Cascade Volcano. More information can be obtained through the USGS’s Cascade Volcano Observatory Website.