Low probability - high impact events present difficulties in weighing the balance of risks in such events. There may be an intellectual understanding that the risk exists and what its consequences are. However, how that intellectual understanding is translated into that marriage of sense and intellect that informs the weighing of risks, is problematic when the high impact event happens so rarely in our experience. Experience, after all, guides our reactions and decision-making in the face of risk. We experience intellectually and emotionally, and this informs future choices. We are guided by instinctual underpinnings that alert us to danger.
When we weigh the balance of risks we look at how to mitigate the low probability - high impact event. This includes identifying the risks and probabilities, assessing how to prevent them if possible and how to mitigate the impacts should they occur. What is the cost of dealing with the risk versus the impacts of ignoring them as if they could never occur in our lifetimes, putting our heads in the sand and tempting to fate?
Studies that the United States Geological Survey (USGS) have done regarding the various risks associated with Mt Rainier are an example of risk assessment. These studies outline probabilities of various classes or sizes of volcanic events occurring.
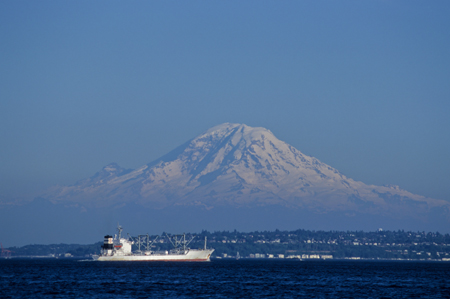
Risks of volcanic hazards have been closely studied on Mt Rainier and are discussed in the USGS report on “Volcano Hazards From Mount Rainier, Washington”, 1995. Mt Rainier’s proximity to major population centers, and it’s size, with a summit at 14,410 feet, mean that Mt Rainier presents an important risk, both in the scale of a potential geological event and potential population impact. Mt Rainier is 54 miles southeast of Seattle and 37 miles east of Tacoma..
The USGS examines each of the volcanic risks in detail. It discusses risks from tephra (volcanic gas/rock ejecta), ballistic projectiles, pyroclastic flow and surges, lava flows, volcanic gasses, debris avalanches and lahars, lateral blasts and glacial outburst floods. All of these are impressive risks. My previous post on Mt St Helens and other Cascade Volcanoes points to excellent USGS material on these topics.
What impressed me most about the Vocanco Hazards From Mount Rainier, Washington (USGS) was the information regarding hazards from debris avalanches, debris flows and lahars. The report states:
“Circumstances conducive to future debris avalanches and debris flows—substantial volumes
of hydrothermally altered rock, substantial topographic relief, great volumes of ice, and the
potential for renewed volcanism—are all present at Mount Rainier. Thus, debris flows are a greater threat to communities down valley from Mount Rainier than any other volcanic phenomenon.” “Volcano Hazards From Mount Rainier, Washington”, (USGS)
Debris avalanches, flows and lahars can arise from weakened mountain rock that has been hydrothermally altered by the action of acidic volcanic gases below the surface to a clay substance that undermines the structure of the mountain, leaving it susceptible to failure. The USGS report, explains this as: “Like a house infested with termites, the affected part of the volcano eventually becomes so weak that it collapses under its own weight, and generates a debris avalanche”
These type of debris flows, containing high quantities of water and hydrothermally altered material are called “cohesive” debris flows.
What I found particularly interesting was that debris avalanches and flows can occur without the type of warning that is typically available when a mountain begins eruptive activity. This may happen if the debris avalanche is due to causes not related to magma movement within the mountain. Weakening in the mountain structure due to underlying hydrothermally altered rock, or, a steepening in mountain slope walls with attendant loss of stability due to glacial erosion (USGS report) can increase the risk of debris avalanche. The historical retreat of glaciers has let mountain sides steepen as the glacier retreats.
The Osceola Mudflow, 5600 years ago, was a cohesive debris flow and the largest debris flow in the last 10,000 years. The flow reached Commencement Bay. The National Lahar, about 1200 years ago flowed all the way to Puget Sound, inundating the Nisqually River.
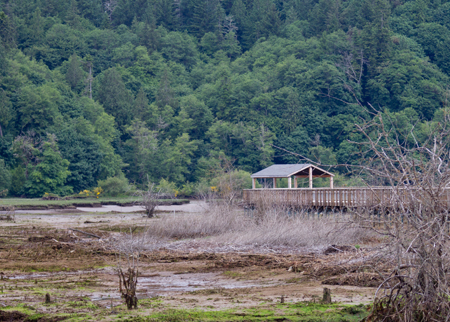
Nisqually Tideflats and Boardwalk, Nisqually Wildlife Refuge, Olympia, Washington (on Flickr)
When we weigh the balance of risks we look at how to mitigate the low probability - high impact event. This includes identifying the risks and probabilities, assessing how to prevent them if possible and how to mitigate the impacts should they occur. What is the cost of dealing with the risk versus the impacts of ignoring them as if they could never occur in our lifetimes, putting our heads in the sand and tempting to fate?
Studies that the United States Geological Survey (USGS) have done regarding the various risks associated with Mt Rainier are an example of risk assessment. These studies outline probabilities of various classes or sizes of volcanic events occurring.
In recent blog articles, Mt St Helens 31st Anniversary of May 18, 1980 Eruption and
Mt St Helens and other Cascade Volcanoes I discussed the impact of the Mt St Helens 1980 volcanic eruption and potential volcanic hazards in the Cascade volcanoes.Risks of volcanic hazards have been closely studied on Mt Rainier and are discussed in the USGS report on “Volcano Hazards From Mount Rainier, Washington”, 1995. Mt Rainier’s proximity to major population centers, and it’s size, with a summit at 14,410 feet, mean that Mt Rainier presents an important risk, both in the scale of a potential geological event and potential population impact. Mt Rainier is 54 miles southeast of Seattle and 37 miles east of Tacoma..
The USGS examines each of the volcanic risks in detail. It discusses risks from tephra (volcanic gas/rock ejecta), ballistic projectiles, pyroclastic flow and surges, lava flows, volcanic gasses, debris avalanches and lahars, lateral blasts and glacial outburst floods. All of these are impressive risks. My previous post on Mt St Helens and other Cascade Volcanoes points to excellent USGS material on these topics.
What impressed me most about the Vocanco Hazards From Mount Rainier, Washington (USGS) was the information regarding hazards from debris avalanches, debris flows and lahars. The report states:
“Circumstances conducive to future debris avalanches and debris flows—substantial volumes
of hydrothermally altered rock, substantial topographic relief, great volumes of ice, and the
potential for renewed volcanism—are all present at Mount Rainier. Thus, debris flows are a greater threat to communities down valley from Mount Rainier than any other volcanic phenomenon.” “Volcano Hazards From Mount Rainier, Washington”, (USGS)
Debris avalanches, flows and lahars can arise from weakened mountain rock that has been hydrothermally altered by the action of acidic volcanic gases below the surface to a clay substance that undermines the structure of the mountain, leaving it susceptible to failure. The USGS report, explains this as: “Like a house infested with termites, the affected part of the volcano eventually becomes so weak that it collapses under its own weight, and generates a debris avalanche”
These type of debris flows, containing high quantities of water and hydrothermally altered material are called “cohesive” debris flows.
What I found particularly interesting was that debris avalanches and flows can occur without the type of warning that is typically available when a mountain begins eruptive activity. This may happen if the debris avalanche is due to causes not related to magma movement within the mountain. Weakening in the mountain structure due to underlying hydrothermally altered rock, or, a steepening in mountain slope walls with attendant loss of stability due to glacial erosion (USGS report) can increase the risk of debris avalanche. The historical retreat of glaciers has let mountain sides steepen as the glacier retreats.
The Osceola Mudflow, 5600 years ago, was a cohesive debris flow and the largest debris flow in the last 10,000 years. The flow reached Commencement Bay. The National Lahar, about 1200 years ago flowed all the way to Puget Sound, inundating the Nisqually River.
Nisqually Tideflats and Boardwalk, Nisqually Wildlife Refuge, Olympia, Washington (on Flickr)
The USGS has grouped debris flows into categories according to severity. Class M, the greatest, applies to the Osceola mudflow. This category occurs too infrequently to allow the USGS to assess an annual probability. The USGS Map Insert Low Probability High Consequence Events shows the extent that would be covered by a class M event.
The USGS Map Volcano Hazards From Mount Rainier similarly displays flows expected from Class I, II and III events. An example of a Class I event is the Electron Mudflow which reached the Puget Sound lowlands. According to the USGS, Category I occurs on average 500 to 1,000 years (over a 5,600 year period) with an annual probability of .1 to .2 percent. Class II occurs on average 100 to 500 years tending towards the lower end of the range with an annual probability of 1 percent. The USGS puts this more in the realm of a engineering categorization of a “100 year flood” in it’s paper. Class III debris flows are more common.

Kautz Creek, Mt Ranier National Park, Washington, March 2008 (on Photoshelter)
The USGS Map Volcano Hazards From Mount Rainier similarly displays flows expected from Class I, II and III events. An example of a Class I event is the Electron Mudflow which reached the Puget Sound lowlands. According to the USGS, Category I occurs on average 500 to 1,000 years (over a 5,600 year period) with an annual probability of .1 to .2 percent. Class II occurs on average 100 to 500 years tending towards the lower end of the range with an annual probability of 1 percent. The USGS puts this more in the realm of a engineering categorization of a “100 year flood” in it’s paper. Class III debris flows are more common.
Kautz Creek, Mt Ranier National Park, Washington, March 2008 (on Photoshelter)
The Kautz Creek Debris Flow of October 2-3, 1947 was an intermediate size debris flow of class II. It was the largest debris flow since the park was established. It is thought to have been triggered by heavy rains that triggered an outburst flood from Kautz Glacier. The photo shows Kautz Creek in snow, with the water coloring reflecting the iron deposits and geothermal activity of Mt Rainier.
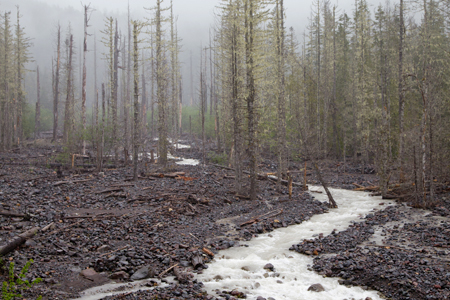
Debris flows occur along Tahoma Creek. These debris flows may impact a bridge near the park entry, thus requiring dredging and other maintenance.
Mt Rainier has displayed some powerful rock and snow avalanche activity in recent days. An article and photographs in the Seattle Times portray this powerful activity.
Mt Rainier “speaks to us”. We cannot simply consider our environment an inanimate actor upon which we act; indeed our environment may present us with challenges that tax our abilities just at the moment when we are most complacent.
I can recall being on the Emmons Glacier with a group when it was 90 degrees in Seattle; suddenly boulders were rolling down the moraine and we soon (carefully) crab-like scurried down the moraine. A wonder that a glacier would want to melt in the heat, but apparently it does just that.
Debris flows often have their origin in heavy rains and hot temperatures.
So the challenge is to internalize the risks in a fashion that doesn’t over exaggerate the low probability high impact event, yet at the same time seeks to mitigate the associated risks with all risk classes. This involves enjoying Mt Rainier in its many splendors while at the same time understanding its risks, even those that may at time seem remote.
Mt Rainier has displayed some powerful rock and snow avalanche activity in recent days. An article and photographs in the Seattle Times portray this powerful activity.
Mt Rainier “speaks to us”. We cannot simply consider our environment an inanimate actor upon which we act; indeed our environment may present us with challenges that tax our abilities just at the moment when we are most complacent.
I can recall being on the Emmons Glacier with a group when it was 90 degrees in Seattle; suddenly boulders were rolling down the moraine and we soon (carefully) crab-like scurried down the moraine. A wonder that a glacier would want to melt in the heat, but apparently it does just that.
Debris flows often have their origin in heavy rains and hot temperatures.
So the challenge is to internalize the risks in a fashion that doesn’t over exaggerate the low probability high impact event, yet at the same time seeks to mitigate the associated risks with all risk classes. This involves enjoying Mt Rainier in its many splendors while at the same time understanding its risks, even those that may at time seem remote.