Mt Rainier

Mt Rainier
Mt Rainier

Tuesday, April 26, 2011

Chernobyl 25th Anniversary


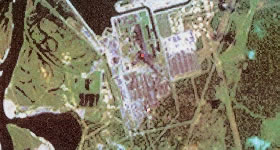
An aerial view of Chernobyl Nuclear Power Plant in April, 1986, with the red glow towards the center showing the heat from Unit #4. Source: epa.gov

The Chernobyl Disaster was a nuclear accident which occurred on April 26, 1986. It occurred in the Ukraine Republic (formerly part of the former USSR (Soviet Union)). Now the Chernobyl site is part of the country Ukraine. Today marks the 25th anniversary of the Chernobyl disaster.

It is particularly compelling to consider the impacts of Chernobyl today, twenty-fives years later, as we witness the unfolding of another nuclear disaster at Fukushima, Japan, following the 9.0 earthquake and tsunami on March 11, 2011. The two disasters arose from different circumstances and unfolded differently, however they share in common the impact of a low probability-high risk event.

They are set apart in both time and space, one occurring in vastness of the then-Soviet Union; the other set on the more densely populated island of Japan. The Chernobyl Disaster and the Fukushima disasters were both were graded as a 7 on the International Nuclear Event Scale. (Fukushima was raised from a 5 to a 7 on April 12, 2011, one month and a day following the earthquake and tsunami on March 11th).

How do we fathom such events as we seek to understand the risks of pursuing nuclear energy? How do we internalize these low probability-high risk events so that we carefully assess risks yet do not fall prey to unwarranted fears and suspicions? Do we hide our heads in the sands of improbability and ignore the potential of a very small yet very dangerous risk? Do we pour millions and billions of dollars to hedge against a risk that may never, in our lifetime occur? Do we even care about the impact of our decisions on those ancestors who may follow us many generations down the turnpike?

It is critical how we answer these questions, because our fate and the fate of our planet may hang in the balance. With the burgeoning population on this planet, the growing scarcity of resources, and the challenges presented by rising carbon dioxide levels, and other indications of planetary strain, we must find a way to make informed decisions that appropriately incorporate the low probability/high risk event in our search for and use of energy resources.

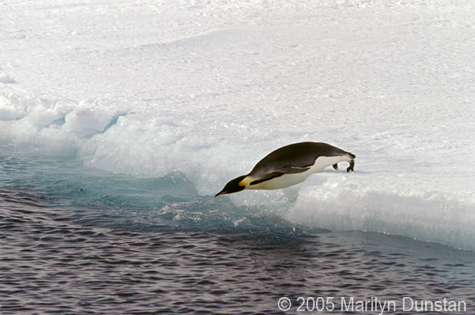
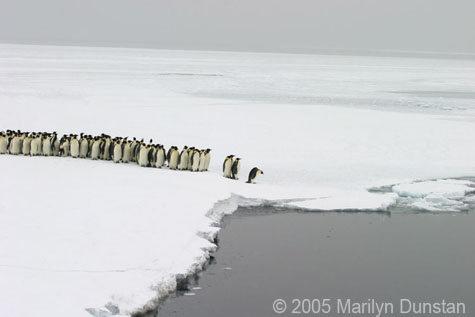
In my last blog posting, Emperor Penguin Energy-Risk Model - Part 2 , I discussed mathematical modeling, random variables and evolved a stochastic model of emperor penguin energy-risk behavior. I discussed some of the variables that may be considered in the emerging emperor penguin population, including mortality, morbidity and accident. I introduced the concept of a low probability event into the model (an eruption of an Antarctic volcano), and discussed the values of the stochastic process in informing results. The post was intended to discuss energy seeking behavior in a different (emperor penguin) population as an energy seeking risk example using stochastic modeling.

In my last post I stated “The objective of the stochastic processes is to help us inform our decision making process, to help us understand the impact of variables under a wide range of assumptions, conditions, and scenarios. Thus a stochastic process should inform us about the expectations of the model under a wide variety of conditions, including the impacts of low probability / high risk events.”

However, a stochastic process cannot inform without reasonable assumptions. Assumptions must be developed to allow the stochastic process to produce a credible range of results that will indeed be informative for the intended usages. There are many variables to consider, and assumptions to be made in analyzing risk. For a variety of reasons it may be difficult to obtain a robust set of assumptions that everyone agrees with for all potential uses.

Thursday, April 21, 2011

Emperor Penguin Energy-Risk Model - Part 2


Emperor Penguin Diving onto Ice Shelf from Sea, Stancomb Wells Ice Edge, Weddell Sea, Antarctica (Image on Alamy.com)

In my last blog post “An Emperor Penguin Energy-Risk Model” on April 14, 2011, l discussed the predator-prey relationship between the leopard seal and emperor penguin in Antarctica. The leopard seal waits at the edge of the ice shelf and opportunistically picks off emperor penguins entering or leaving the sea. For the emperor penguin, feeding at sea is a decision between the need to feed to live and the risk of dying in the mouth of a leopard seal..

In the blog post I state: “From studying the emperor penguin and the leopard seal we know the emperor penguins will continue to feed, but so will the leopard seal. Some emperor penguins, despite their various risk protection strategies, will get eaten. It is important to note that in a probabalistic sense, we know that some penguins will be eaten by the leopard seal, but we don’t know which specific penguins will “bite the dust”.” This is true casually looking at a row of emperor penguins lined up to go into the sea in search of food.

However, upon closer analysis and study, over a period of time, it might be possible to determine which emperor penguins have a bit of catch in their step, have been injured in a narrow escape from a leopard seal, or have slowed down. These emperor penguins might come a belly-flop short of landing on the ice, and end up as prey in the mouth of a leopard seal. However, it is also possible, that a healthy, fit, member of the emperor penguin colony might suffer a particularly ill-fated episode of bad luck. This penguin might be in the wrong place at the wrong time when the leopard seal is rising out of the water with its mouth wide open ready for business. In fact, you could have the emperor penguin equivalent of the 4.0-40 yard dash champion, and end up as leopard seal “dinner”, with some bad luck and timing.

Looking at emperor penguin energy-seeking behavior and risk, it becomes apparent that probabilities have a great deal to do with the outcome but are not deterministic. You may attach a relatively higher probability of being eaten to the more fragile members of the emperor penguin population and a relatively lower probability of being eaten to those fitter members. The larger the colony size, and the more emperor penguins entering the sea at the same time, the lower the risk, the probability of being eaten, for any particular emperor penguin as there are more penguins entering the sea. (“there’s safety in numbers”).

You can run scenarios with differing proportions of fragile and fit emperor penguins, with higher and lower probabilities of being eaten (mortality rates), varying degrees of illness (morbidity rates) or accident, including leopard seal attack. In such scenarios, the leopard seal would most likely pick off different emperor penguins each time the scenario is run, however there would be objective tendencies to pick off more members of the more fragile group versus those of the fitter group.

In performing mathematical modeling of the fate of the emperor penguins by running scenarios with objective data and assumptions, we may set up a stochastic process which helps us to understand the behavior of the system as it evolves under a variety of scenarios.

Mathematical models involve expressing real world problems in mathematical language. This entails defining variables and establishing a formulaic process which will express the model as evolves. Variables are elements in the model which may change during the model. Because they may change, the model needs to calculate how they change over the course of the model and how they interact with other model variables, and are affected by the constants assumed by the model. Constants may arise from established data or may be assumptions plugged in to the model.

Stochastic processes incorporate non-deterministic, random elements into a mathematical model. The result may vary with time and with each model run. In comparison, a deterministic model will always produce the same result given the same assumptions and initial state. Thus, a stochastic process is run using random processes, employing a variety of assumptions and probability distributions informing objective tendencies for various model events to occur..

The random process in stochastic modeling will randomly choose which penguins are attacked, survive, suffer morbidity or injury from accident, and die over a period of time. Each run will be unique, as specific, members of the colony are differently impacted by the random process each time. By running many such models, one can get a picture of the survival data for the colony as a whole under a wide range of assumptions. Depending on the characteristics of the data, model and variables, results may be similar on an overall group basis, while differing by individual members impacted over time.

Under a normal range of assumptions and outcomes, this model may well predict overall group behavior over a period time. However modeling becomes much challenging when very low probability events enter into the model or rear their head in actual life.

For example, a eruption of an Antarctic volcano may be infrequent, however it could certainly impact emperor penguins. If the model assumed a volcanic eruption with a low probability, a robust number of stochastic model runs may randomly select such an event resulting in a BBQ penguin supper for the leopard seals.

The objective of the stochastic processes is to help us inform our decision making process, to help us understand the impact of variables under a wide range of assumptions, conditions, and scenarios. Thus a stochastic process should inform us about the expectations of the model under a wide variety of conditions, including the impacts of low probability / high risk events.

Thursday, April 14, 2011

An Emperor Penguin Energy-Risk Model


Emperor Penguin Preparing to Dive off Riiser-Larsen Ice Shelf (Image on Alamy)

The emperor penguin (aptenodytes fosteri) is the largest of the penguin species and lives in Antarctica in large colonies. Emperor penguins live in the harshest of climates in Antarctica, where the temperatures can get down to 40 degrees Fahrenheit and with strong winds up to 89 mph, developing a sizable wind chill factor. The penguin breeding colony stays together during the harsh winter, constantly churning the boundaries of the colony, sustaining the group.

The female emperor penguin lays one egg, which is nurtured by the male while the female returns to sea to fish. The male will then nurture the young chick in his brood pouch. Later, both parents take turns hiking to the ice shore, diving into the Antarctic waters, in search of food. Fish and crustaceans such as krill provide sustenance for the penguin, energy to keep it going.

This source of penguin energy is available from “the deep”. Lots of krill. Lots of fish. Lots of energy to power penguins. One catch. A predator. The leopard seal (Hydrurga leptonyx). The leopard seal is a large mammal (between 400 and 1300 pounds) that attacks the emperor penguin, often at the edge of the ice where it can make opportunistic kills. This video by BBC Earth shows the interaction between a leopard seal and emperor penguins.


Emperor Penguins Lining up to Dive into water at Halley Bay Ice Edge (Image on Alamy)

A decision by an emperor penguin to dive into the water at ice’s edge is a decision to face a risk of being killed by the leopard seal or starve. Emperor penguins will accumulate in a line at the edge of the ice, waiting to take off, en-masse, into the water to feed. A tipping point is reached at some point where the shared risk of the group warrants all exiting off the ice edge into the cold deep, in quick succession. Feeding takes place in the open water and the emperor penguins quickly launch themselves through the air as they exit the water to land on the ice edge. They are playing the odds.

The emperor penguin’s appearance manages its risk to a certain extent. The emperor penguin’s black and white exterior helps to mitigate risk. The penguin’s black back appears lost looking downward against the black background of the marine deep. Looking upward from below, the emperor penguin’s white belly may be lost in the white glare of the water surface. This provides some degree of camouflage.

The penguins’ group decision, so neatly balanced in their emperor penguin-risk-matrix minds conceptually captures the “weighing of risks” issue as regards satisfying their energy needs. The penguin needs to take risks in order to eat, to supply energy, in order to live.

Food, after all, supplies energy that keeps us in business just as the various types of fossil fuels, nuclear energy and alternative energy sources provide energy for us to meet our various needs.

Our planet seems to shrink around us with population growth, economic development, energy demand and climate change challenges. As we seek to manage our lifestyles in this challenging environment, we are not unlike the emperor penguin. We face risk in pursuing our energy wants and needs.

We can analyze the risk patterns associated with the various energy choices that we have. These risk patterns vary considerably depending on which mix of energy resources are employed.

From studying the emperor penguin and the leopard seal we know the emperor penguins will continue to feed, but so will the leopard seal. Some emperor penguins, despite their various risk protection strategies, will get eaten. It is important to note that in probabalistic sense, that we know that some penguins will be eaten by the leopard seal, but we don’t know which specific penguins will “bite the dust”.

Similarly, as we explore various energy choices, we need to study the associated risks. We need to anticipate risks that may happen and proactively build defenses against them. However, we are kidding ourselves if we think that we can forever eliminate all such risks. It is the nature of evolving life to defeat such a worthy goal, as accidents can happen. It may be possible to predict the fact that accidents may happen while at the same time not being able to pinpoint exactly where or when they may occur. This consideration lends itself to a more global view of risk management, rather than focusing on any one particular potentiality.

In considering the risks associated with expanding energy sources to meet demand, its also appropriate to bring up ways to reduce energy demand, to become more efficient, to do more with what we have. This option becomes more attractive as the costs of the alternative options increases.

Monday, March 28, 2011

Energy Choices and Risk


Japan’s March 11, 2011 Tohoku 9.0 earthquake, ensuing tsunami and nuclear incident at Fukushima Daiichi Nuclear Plant have reminded us all that nuclear plants are subject to risk. This should be no surprise, as all sources of energy are subject to some degree of risk. In fact, just about everything in life has some degree of risk attached to it. However, nuclear plants, with their added radioactivity risk, present a considerable challenge in managing the lower probability, higher impact events.

We face global, environmental challenges in managing climate change issues. These climate change issues affect both micro-climates and have a planet-wide impact. In order to meet these considerable challenges, nuclear energy must be a part of the solution along with other energy options. We must seek to understand and mitigate risks facing nuclear plants as we go forward to solve the larger planet-wide problem which affects us all.

It has been almost 25 years since the April 26, 1986 nuclear incident at Chernobyl, in the Ukraine. That incident was ranked at “7” on the International Event Scale. The Three Mile Island Accident, beginning on March 28, 1979 ranked as a “5”. That incident, occurring exactly 32 years ago, took place at the Three Mile Island Plant in Middletown, Pennsylvania. The Fukushima Nuclear Accidents have so far been ranked as high as a “5”, and the situation has not yet been resolved .

In the midst of the efforts to bring the Fukushima Reactors under control, there have been calls to reexamine the safety of nuclear power plants. The International Atomic Energy Agency (IAEA) called for a meeting before the summer to discuss an assessment of the Fukushima accident, lessons to be learned, strengthened safety measures and strengthened responses to future incidents.

As the Japanese workers worked on the reactor, rating agencies Moody’s Japan K.K. and Standard and Poors downgraded Tokyo Electric Power Company (Tepco’s) long term debt. Moody’s indicated that it saw risk in GE’s nuclear business, although it did not downgrade GE, which contributes 1% of GE’s annual $100 billion revenue. GE was the designer of the Fukushima nuclear power plants., and the supplier of reactors 1,2 and 6.

At the same time, ongoing issues regarding the storage of the nation’s nuclear waste are unfolding. This waste includes waste from commercial nuclear plants and military/defense waste products. The waste is stored in a variety of locations, ranging from storage on site to storage at the Hanford Site, in Washington State, where two-thirds of the nation’s high-level radioactive waste is stored. The storage issues are complex, involving the removal of the nation’s only designated nuclear waste repository from consideration, and related litigation by states (Washington and South Carolina) and regulators (National Association of Regulatory Utility Commissioners).

We should develop an energy strategy that optimizes the risk profiles of the various types of power generation (including nuclear). This strategy should be science-based, above politics, in the interest of the nation (and world) as a whole, reflecting our responsibilities to the environment both in theory and in practice, and appropriately reflecting risks in pricing decisions.

Friday, March 25, 2011

Processing Risk and Uncertainty


Koi Surfacing, Japanese Gardens, Washington Park Arboreteum, Seattle, Washington

In my last blog posting I discussed the question of how we integrate our feelings, our sensations, perceptions with scales we use to measure risk. My discussion centered around the Japan 9.0 Earthquake and the moment magnitude scale used to measure it.

In fact, the earthquake was originally judged to be an 8.9 by the United States Geological Survey (USGS) and subsequently upgraded to 9.0 by the USGS. The moment magnitude scale, being logarithmic, meant that this reassessment implied a 41% more intense earthquake than the original 8.9. This reflects logarithmic scales in action.

As the disaster unfolded, the world could see the Japanese heroically struggling with a trifecta of horrors -- the initial earthquake itself, the tsunami that followed, and the accident at the Fukushima I Nuclear Power Plant (Fukushima Daiichi) in Fukushima, Japan.

News coverage of the Japan disaster was continuous in the media. However, with military intervention in Libya by a group of nations including the Canada, France, Italty, United Kingdom and the United States, the coverage of the Japan disaster on television has diminished.

How do we respond when events are at the forefront of the news? How do we respond when they are forced by circumstance to share the spotlight with other compelling, competing issues or even tucked away out of sight? How do we respond with our feelings towards others in their disaster, or triumph, and how do we translate those feelings into our own forward seeking risk assessments?

Indeed, there are compelling issues on the horizon, decisions to be made, and the evolving situation in Japan is certain to be a part of the equation in attempting to balance risks in managing our future with respect to energy, focus and other issues.


American Red Cross Donations

Saturday, March 12, 2011

Log in the Surf - 8.9 Japan Earthquake (9.0 updated)


The above picture, captured in Westport, Washington, as waves pounded the shore and caused flooding downtown, doesn’t come anywhere near to doing justice to the devastation in Japan after the 8.9 earthquake. The log, as small as it seems in the distance of the breaking wave, however, serves as a metaphor, as it seems to come out of nowhere, to be crashed with great force upon the shore. To the beach goer these logs represent unseen risk until they emerge from the seas of possibility and are thrust upon the beach.

I watched the enfolding news on CNN of the magnitude 8.9 earthquake off the east coat of Honshu, Japan. The earthquake, which occurred at 05:46:23 UTC on March 11, 2011, has been devastating for the Japanese people. The earthquake, the tsunami that followed, the tragic loss of life and injury, the damage to structures (including nuclear power plants) and communities has had a devastating impact.

Due to the scope of the event, and its aftermath, which is still unfolding, it will take some time to assess the full extent of the damage. As of this writing, there is worry about a possible nuclear plant meltdown (Voice of America article).

My thoughts go out to the Japanese people, and others impacted, with the hopes that aid can help reach those in need and aid in the rebuilding.


How do you fathom such a devastating event with such a magnitude? How do you measure an event such as this, perceive and integrate it on all levels?

Earthquakes are measured by scales. The Richter scale was commonly used to measure earthquake magnitudes. However the Moment Magnitude Scale is the preferred magnitude used by the United States Geological Society (USGS), as explained in the USGS link. The scales used to measure earthquakes are base 10 logarithmic scales.

The Moment Magnitude Scales of two earthquakes can be used to compare their relative intensities, as indicated in the Wikipedia article. It involves solving for the scalar moment, determining the ratio of scalar moments being considered, and boiling down the resulting equation. For two earthquakes with moment magnitude scales M1 and M2 this relative intensity boils down to 10^(1.5*(M1-M2)).

This formula shows how the relative factor between earthquakes remains the same for the same differences in Moment Magnitude, regardless of whether you are referring to differences between 5 and 5.1 or 7 and 7.1. In either case, the earthquake will be 1.4 times as intense as the earthquake you are comparing with. Similarly a 6.0 earthquake will be 31.6 times as intense as a 5.0 earthquake and an 8.0 earthquake will be 31.6 times as intense as a 7.0 earthquake. A 7.0 earthquake will be one-thousand times as intense as a 5.0 earthquake and a 9.0 earthquake will be one-million times as intense as a 5.0 earthquake.

With geometric progression the intensity curve explodes upwards at higher end magnitudes as the factor is applied to larger an larger numbers.

How do we incorporate our feelings, our sensations, our perceptions associated the an earthquake, and associated events, and how do we integrate those perceptions with the scale used to measure them? Our brains have to build some type of association, a risk measurement that links this experience together.

This is an important question as we deal with forward pointing risk assessment and risk management, as we use our minds to project both risk and opportunity.